

06
Jan
How to Read an Electrocardiogram? Introduction to Wave Pattern Interpretation and Inspection Process
Electrocardiogram is a common detection method used to detect heart rhythm. By attaching electrode patches to the subject’s body, the electrocardiogram instrument can display the electrical potential changes of the heart. But do you know what the ups and downs of the waveform on the screen represent? This article will analyze the interpretation of electrocardiogram waveforms, the electrocardiogram examination process, and give examples of applicable conditions and corresponding cardiac symptoms.
Why do we need an electrocardiogram?
An electrocardiogram is a convenient and fast way to test your heart at no extra cost. Basic heart information, such as heart rate, heart potential changes, etc., can be learned from the electrocardiogram results. Generally speaking, the following symptoms may warrant an EKG:
- Chest pain
- Difficulty breathing
- Palpitations
- Weak
- Dizziness, lightheadedness
- Fainting
Speaking of potential changes, some people may think that ECG is only related to arrhythmia, but myocardial infarction can also be determined by ECG, because fatty plaques block blood vessels, causing myocardial hypoxia, which can also affect It can even determine which area of the coronary artery is blocked from the abnormal waveform. Other heart problems that can be detected through electrocardiogram include coronary heart disease (also known as ischemic heart disease), cardiomyopathy, myocardial hypoxia, etc.
In addition, an EKG may be used to evaluate heart health before surgery, to check the operation of the heart rhythm regulator, or to understand the effectiveness of certain heart medications.
Static ECG cannot show the patient’s heart rhythm condition under stress or for a long time, so there are different types of ECG such as exercise ECG and 24-hour ECG. Through different projects, electrocardiogram can help patients detect major heart diseases at an early stage.
How to read an electrocardiogram? Interpretation from wave pattern
PQRST wave
First, let’s take the following picture as an example:

This is the potential change produced by a complete heart beat. Generally, when we look at an electrocardiogram, we usually divide the waveform into P, Q, R, S, and T parts to help determine the heart rhythm. The following are the meanings they each represent:
- P wave: The first deviation in a complete cardiac potential change is called P wave. At this time, the atria will depolarize and cause the atria to contract.
- PR segment: refers to the time period between P wave and QRS wave.
- QRS wave group: QRS is not a fixed order. In terms of naming, the first downward deflection waveform in the wave group is called Q wave, if it goes upward, it is called R wave, and the negative deflection after the R wave is called S wave. Wave. It is worth noting that QRS does not necessarily exist at the same time. There may also be the possibility of only QR, QS, or even only R wave.
- ST segment: The time period between the QRS wave and the T wave.
- T wave: Repolarization of the ventricles causing ventricular relaxation.
- QT interval: refers to the length of time it takes for the heart to contract to the end of diastole. There is a type of “long QT syndrome” which refers to cardiac symptoms caused by an excessively long QT interval.

3 abnormal waveforms of electrocardiogram
Since the types of waveforms vary greatly, only three common abnormal waveforms are listed below as examples:
Q wave drops sharply
In a normal electrocardiogram, the Q wave usually only shows a small dip. If the Q wave dips deeply, it may mean that a myocardial infarction has occurred.
R wave rises sharply
If an abnormally tall R wave appears on the electrocardiogram, it may indicate left ventricular hypertrophy, which causes waveform amplification.
T wave inversion
In a normal electrocardiogram, the T wave usually shows a positive deflection. If the T wave deflects negatively, it may represent ischemia or myocardial infarction in the heart.
Introduction to electrocardiogram equipment
Generally, twelve-lead electrocardiograms are used for electrocardiogram examinations. The subject must affix 10 electrode patches on the chest and limbs and connect them to the electrocardiogram instrument to display the heart rhythm waveform.
“Wait a minute, why do twelve-lead electrodes only have 10 electrode patches?”
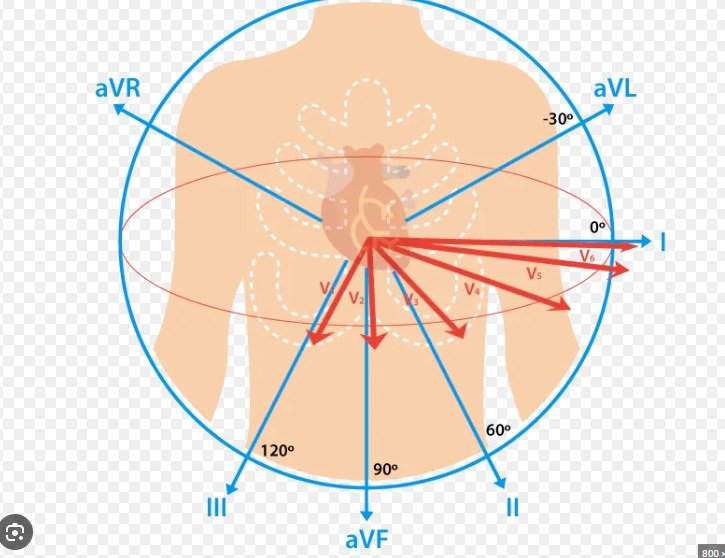
This requires first understanding the meaning of these electrode patches and leads. The principle of electrocardiogram is to construct leads through electrode patches to record potential changes in different directions. With 10 electrode patches attached to different parts, the electrocardiogram can show potential changes in different directions and angles, allowing for a more accurate interpretation of which part of the heart has problems. The following are the names and classifications of the twelve leads:
Standard limb lead
- The lead of the first limb: the left hand is the positive pole and the right hand is the negative pole.
- Second limb lead: left foot is positive, right hand is negative
- Third limb lead: left foot is positive, left hand is negative
Strengthen limb lead
- AVL lead: left hand is positive
- AVR lead: The right hand is the positive pole
- AVF lead: left foot is positive
Chest lead
- V1: The fourth intercostal space on the right side of the sternum
- V2: The fourth intercostal space on the left side of the sternum
- V3: the midpoint between V2 and V4
- V4: The fifth intercostal space opposite the center of the left clavicle
- V5: The midpoint between V4 and V6
- V6: The fifth intercostal space below the left armpit
Electrocardiogram examination process
The electrocardiogram examination is very safe, there is no risk of electric shock and the measurement can be completed in just a few minutes. However, the subject should be careful not to smoke, drink irritating drinks such as coffee or strong tea within 1 hour before the test, and not to do any strenuous exercise before the test. sports. The following is the electrocardiogram examination process:
- Remove items that affect current conduction
Watches, metal jewelry, stockings, pantyhose, etc. will affect the conduction of current. - Take off your shirt or expose your chest, then lie flat on your back
The subjects took off their shirts or pulled them up to expose their chests and lay flat on the hospital bed. - Apply wet cotton ball to chest and limbs
The examiner uses a moistened cotton ball to smear the subject’s chest and limbs. - A total of 10 electrode patches are connected to the chest and limbs
The examiner attaches ECG patches to the subject, including 6 chest lead electrode patches on the chest and 6 limb lead electrode patches on the limbs (1 patch for each limb). A total of 10 patches need to be connected to wires to the instrument. - Lie down quietly to avoid shivering that may affect measurement accuracy.
Ask the subject not to move or speak, and to lie flat with normal breathing. The examiner also pays attention to whether the subject is shivering due to cold, so as not to affect the measurement accuracy. - Remove the electrode patch, wipe the skin clean and put on clothes
After the examination is completed, the examiner removes the electrode patch, wipes the subject’s skin and helps the subject put on clothes.


